Debug Session
Create and configure the debug session
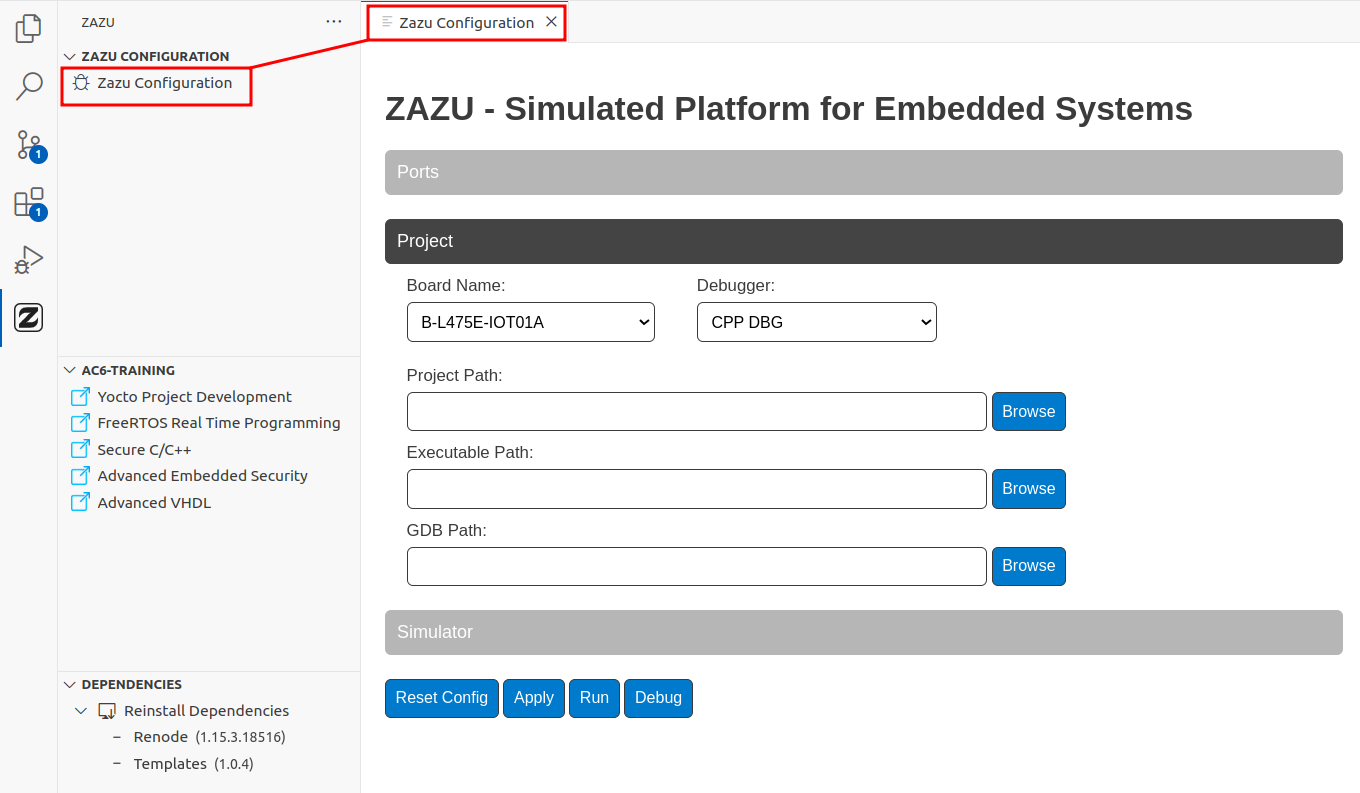
Zazu Configuration
To create or configure the debug session, click on "Zazu Configuration" to open a debug configuration form.
-
The View Configuration consists of three sections:
- Ports: Allows configuration of the generator's ports, primarily for advanced use.
- Projects: Contains the necessary information for the simulator to interact with your project.
- Simulator: Includes simulator-specific configurations, useful for advanced scenarios.
-
Select the right board for your project
-
Click on the Project Path field—a dropdown list of projects in your workspace will appear. Select your project.
Start debugging
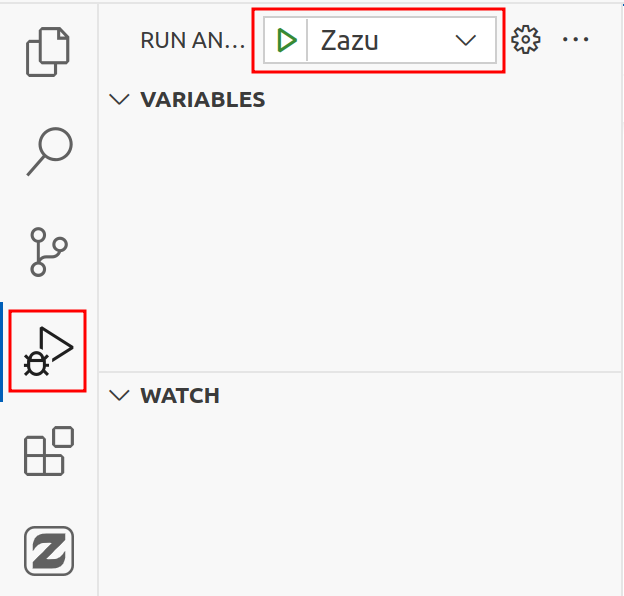
To start the debug session, click on "Debug". If a previous debug session was already configure, you can relaunch the debug session from VS Code Run and Debug view.
- Go to the "Run and Debug" (Ctrl+Shift+D) activity panel
- Select the launch configuration for your project
- Click on the Run button
Debug your application
After starting the debug session, the code should breaks on main or earlier (depends on optimizations set up for your project).
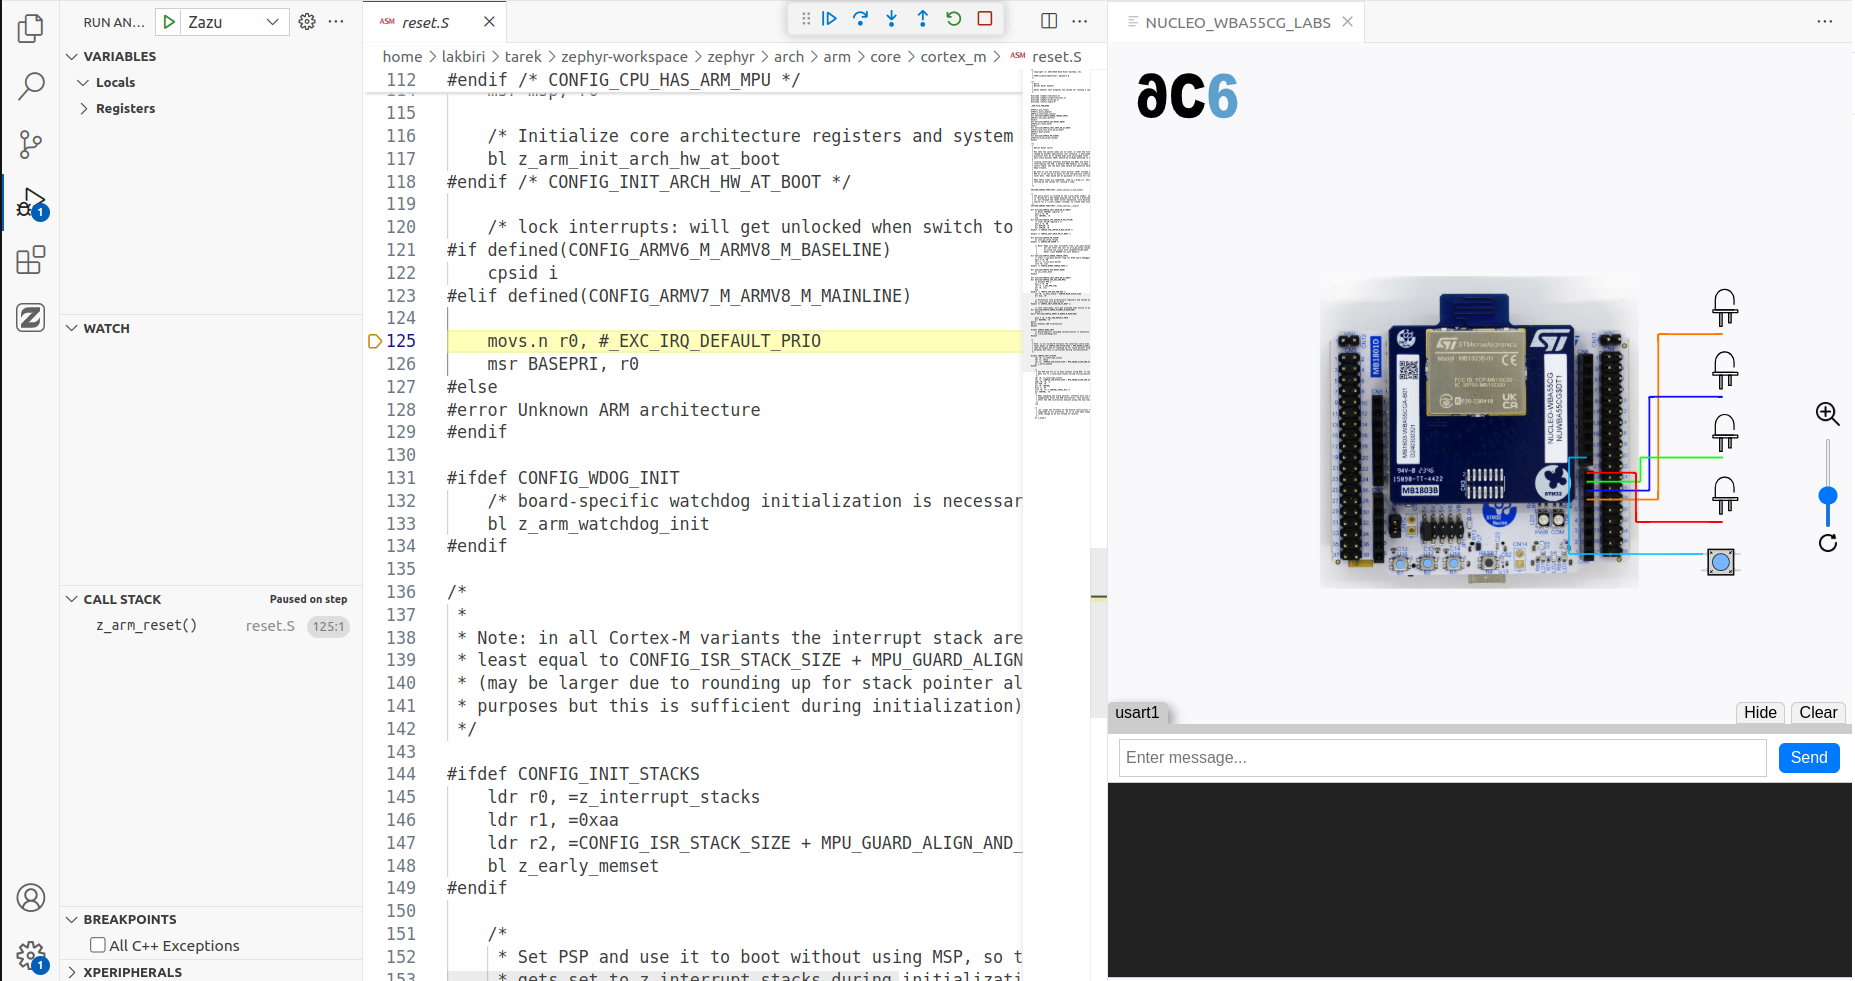
Debug actions
The "Debug Toolbar" appears on the top and allows you to:
![]()
| Action | Explanation |
|---|---|
Continue/Pause F5 | Continue: Resume normal program/script execution (up to the next breakpoint). Pause: Inspect code executing at the current line and debug line-by-line. |
Step Over F10 | Execute the next method as a single command without inspecting or following its component steps. |
Step Into F11 | Enter the next method to follow its execution line-by-line. |
Step Out Shift+F11 | When inside a method or subroutine, return to the earlier execution context by completing remaining lines of the current method as though it were a single command. |
Restart Ctrl+Shift+F5 | Terminate the current program execution and start debugging again using the current run configuration. |
Stop Shift+F5 | Terminate the current program execution. |
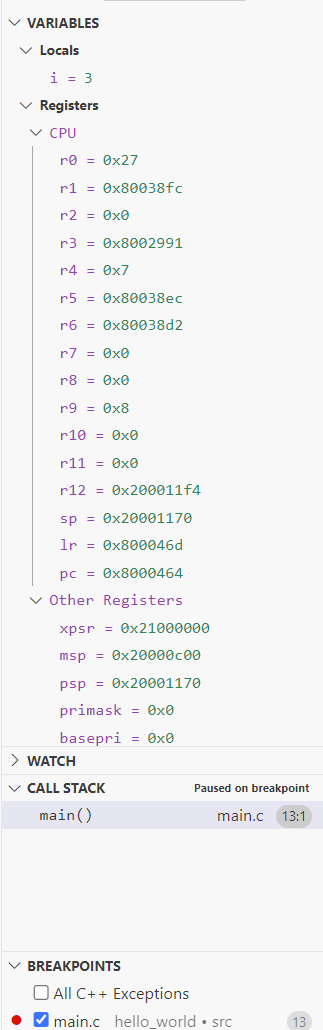
Data inspect
Inspect variables and CPU registers on the left panel
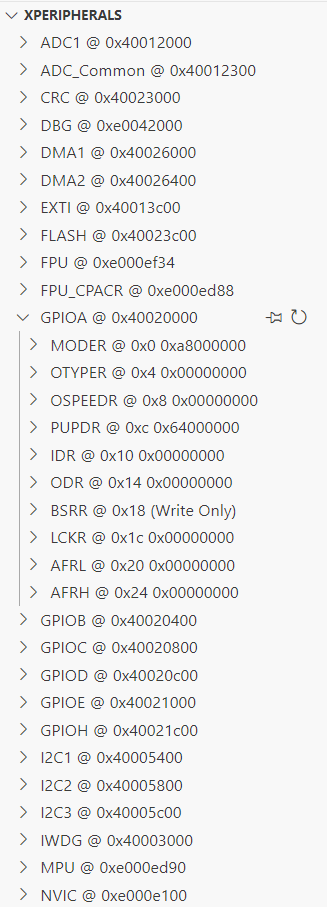
If the SVD file was set in the debug configuration, the peripherals are displayed in the "xperipherals" view.
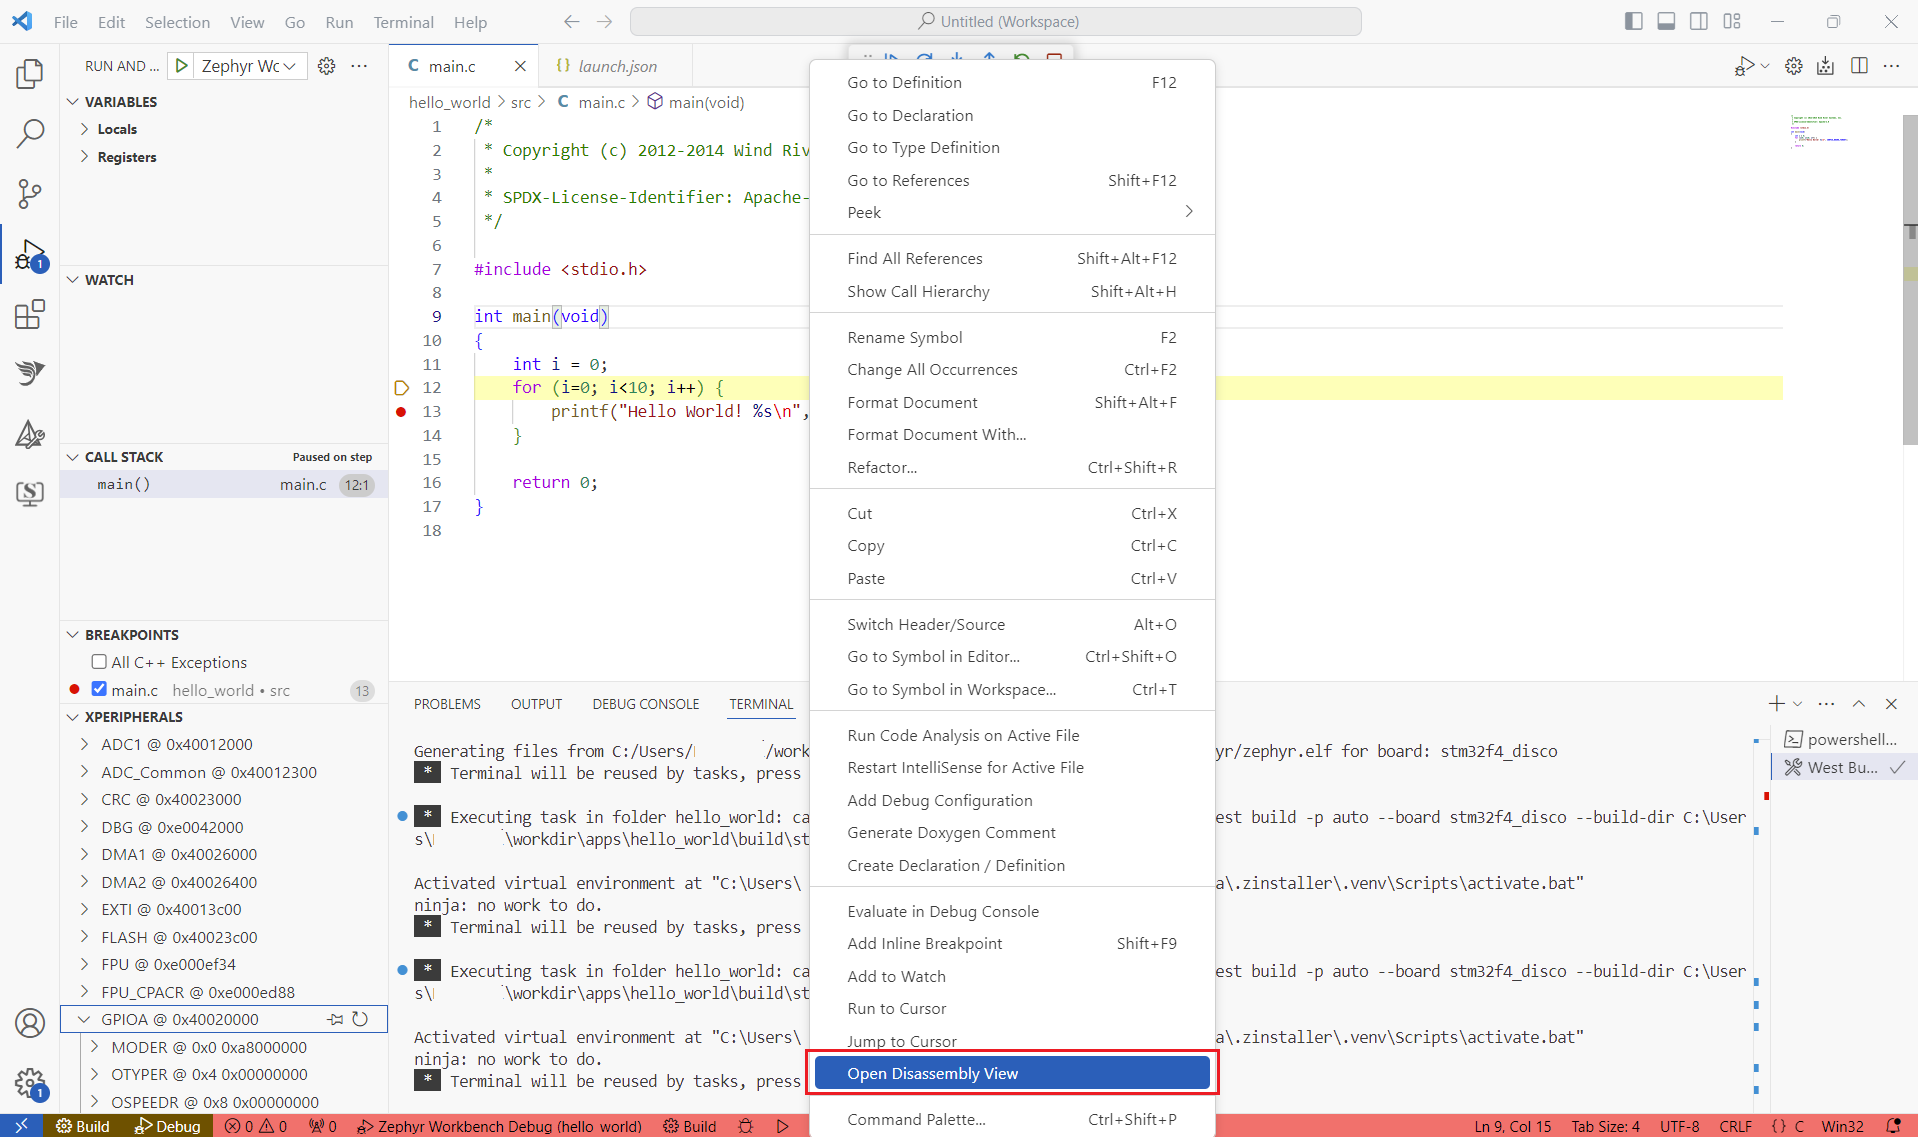
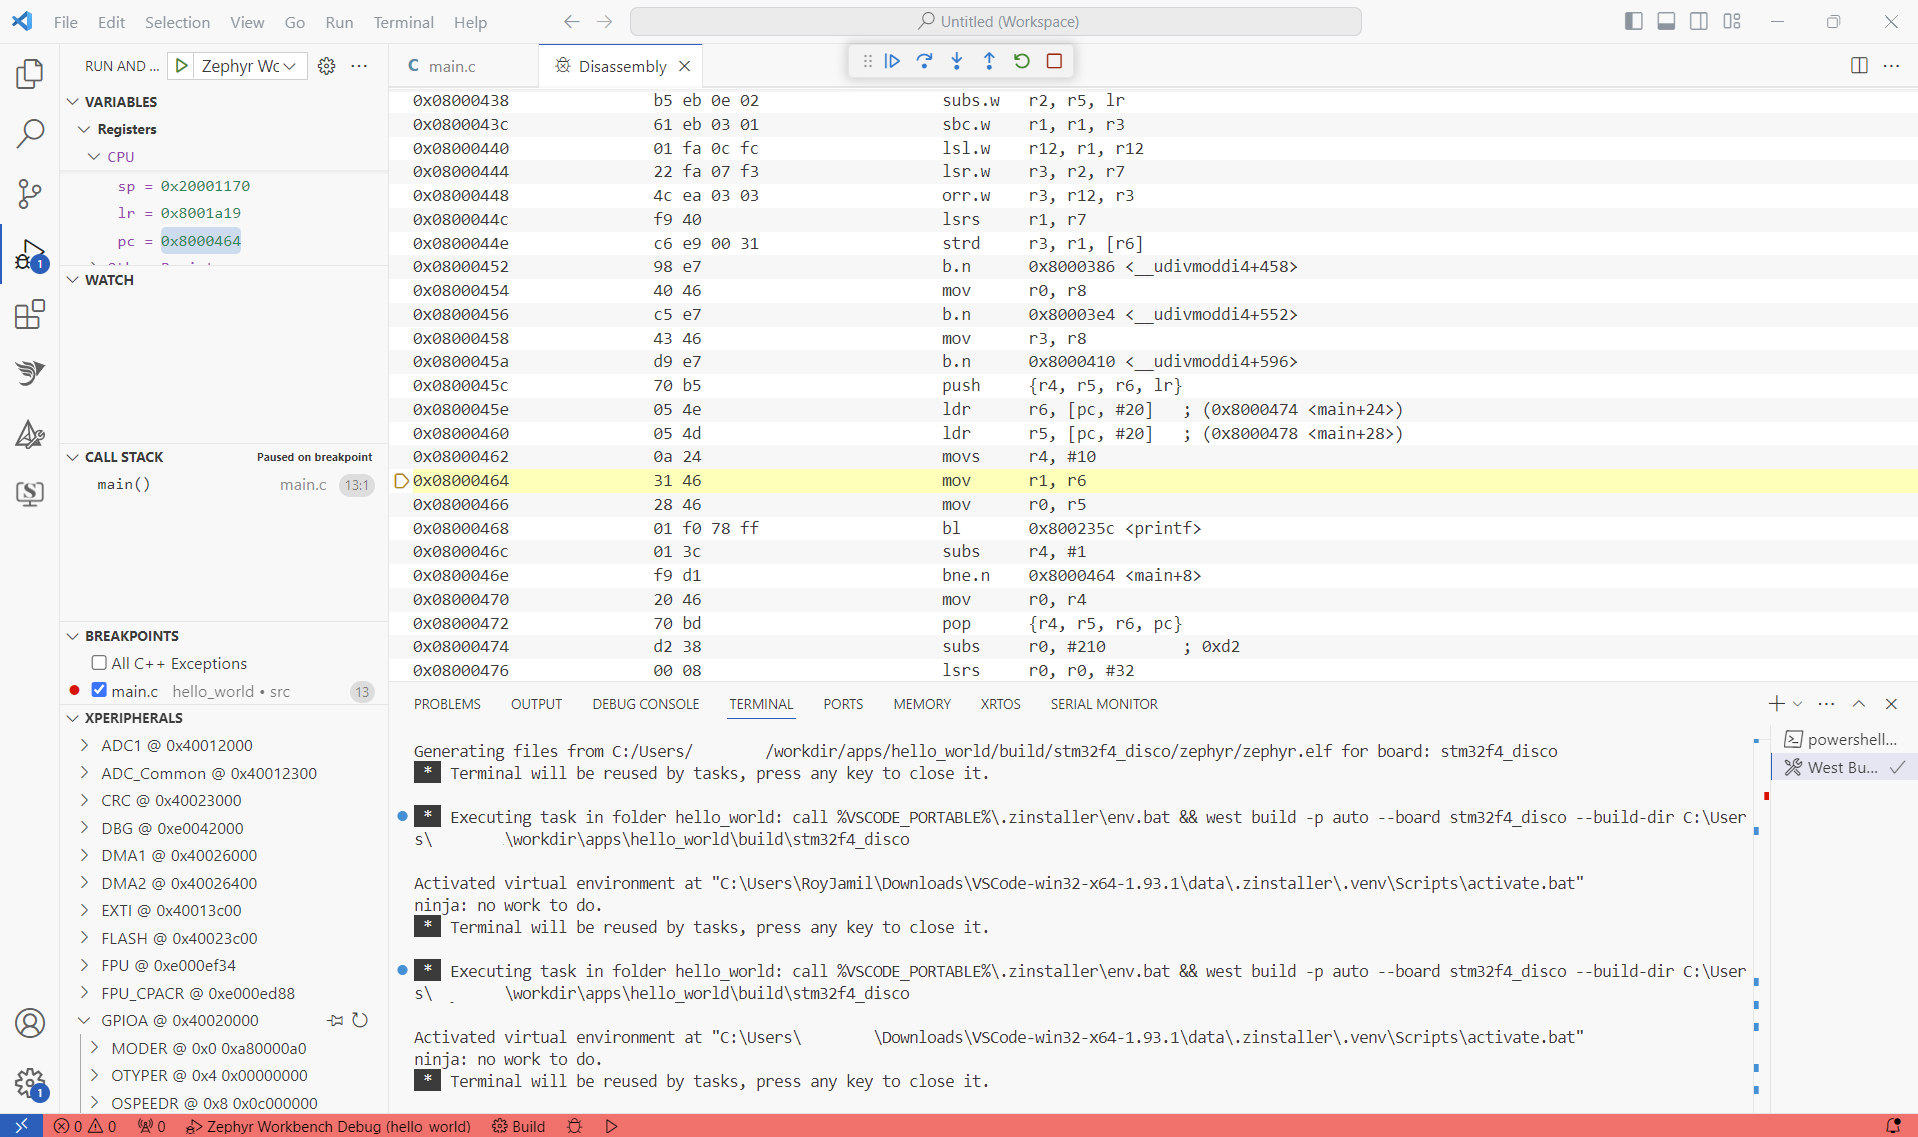
To debug in disassembly, right-click on the code then select "Open Disassembly View".
More information about Debugging on VSCODE